Problem
Our idea started from a problem. 30% of patients don't show up to their medical appointments.
The best current solution to this problem is to send an SMS reminder to patients, however, this method is shown to be ineffective.
We found a dataset of 300K medical appointment records containing information about the rates of patients showing up to their appointments and the variables involved. So, we decided to analyze this data and to find some useful insights to hopefully lead us to a better solution.
Cleaning Data
The first step was to clean the data and extract the most important variables.
The appointment and booking date were given as strings. To make them meaningful, we had to extract hours, day and month from them as individual variables.
As a second step, we converted each variable (even day of the week or gender) into a numerical value, to make it easier for our algorithms to build the model.
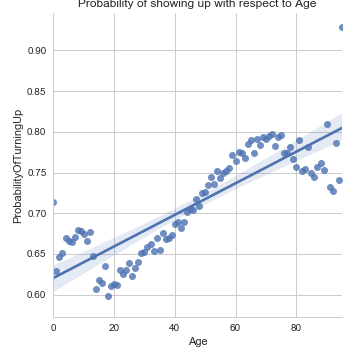
From this chart, we can clearly see that different ages have different probability of showing up, however, we can see that a linear regression model would not fit the data.
Three clusters of individuals are obvious.
One cluster is those aged between 0 and 18. They are probably going to go to the doctor with their parents, so they are reasonably likely to show up. It is clear that as soon as people turn 18, and stop going with their parents, their probability of turning up decreases dramatically. From the age of 18 onwards there is a clear increasing trend that shows that older people are more likely to turn up.
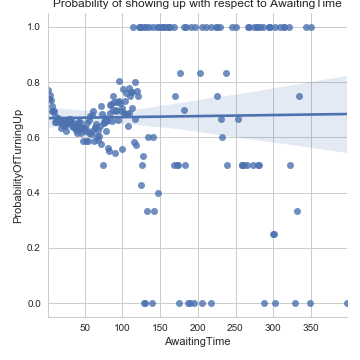
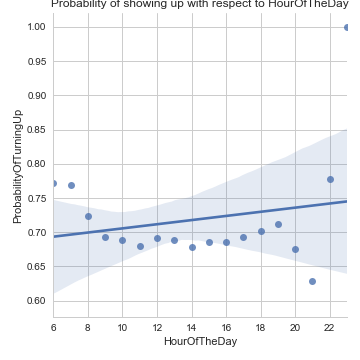
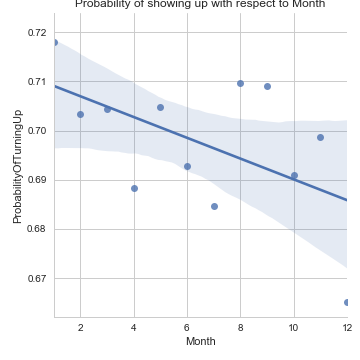
This graph shows that the time between the day the appointment is booked, and the day of the appointment itself, doesn't affect the probability consistently.
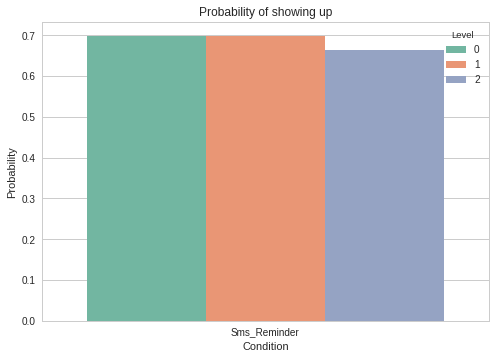
Very interestingly, sending people sms doesn't look a very effective way of improving attendance.
We even tried to look at this metric only for patients aged between 18 and 30 (most likely to actively use sms), but the result was the same.
Building a predictive model
The next step was to use the insights we got from analysing the data and try to build a Machine Learning model to predict what's the probability of a given patient not turning up.
We tried different models.
The first one was AWS Machine Learning API, which gave us a AUC of 0.608, which is a acceptable result.
However, at the end we preferred to write ourselves the code using python libraries, which made customisation much easier.
went for a Bayesian model that gave us a still reasonably good AUC of 0.58.Applications
This model clearly shows how a deeper insight into this data could help to alleviate the inefficiency in patient attendance.
Now we propose one of the many use-cases that this analysis could have:
The cost to a medical practice when a patient doesn't turn up is high - £100. It is also inefficient to call all your patients who have booked an appointment. But what if we could selectively target the 10% of them least likely to turn up? Let's say this 10% normally has a no show rate of 40%. Out of 100 appointments, this would result in a loss of 100 * 40 = £4000. Targeting this 10%, if we could lower their not show probability to 30% or less, £1000 could be saved for every 100 appointments. The cost to call these 10% of patients is low - 0.1 * 100 = £10.
This gives a net saving of 990£ every 100 appointments.
To sum up, a GP could give us their list of future appointments, we could run our model on it and find out the 10% of the patients least likely to show up.
Using an effective reminder method, like for example a phone call, the GP could substantially improve the probability of those patients showing up, without without the need to contact those patients who are likely to tun up.
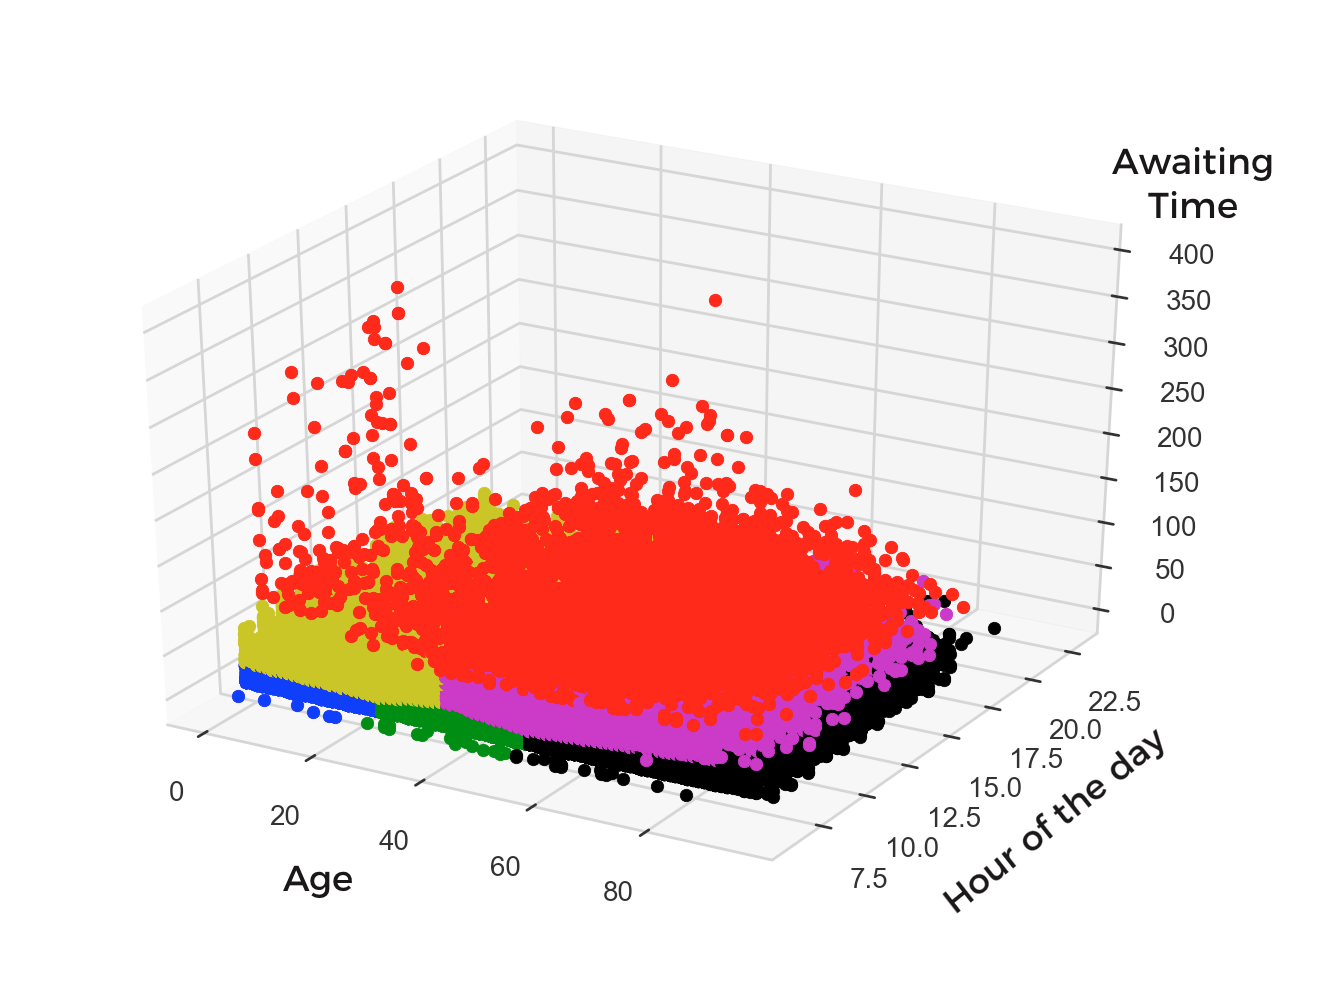
Currently, we talk about the patients belonging to 3 groups by age. In future, we can use k-means clustering algorithms to have a better group distribution. We can group people based on other conditions and not just the age. The plot represent all the 300K people divided into 6 groups based on their Age, Time of the appoinment and the awaiting time.
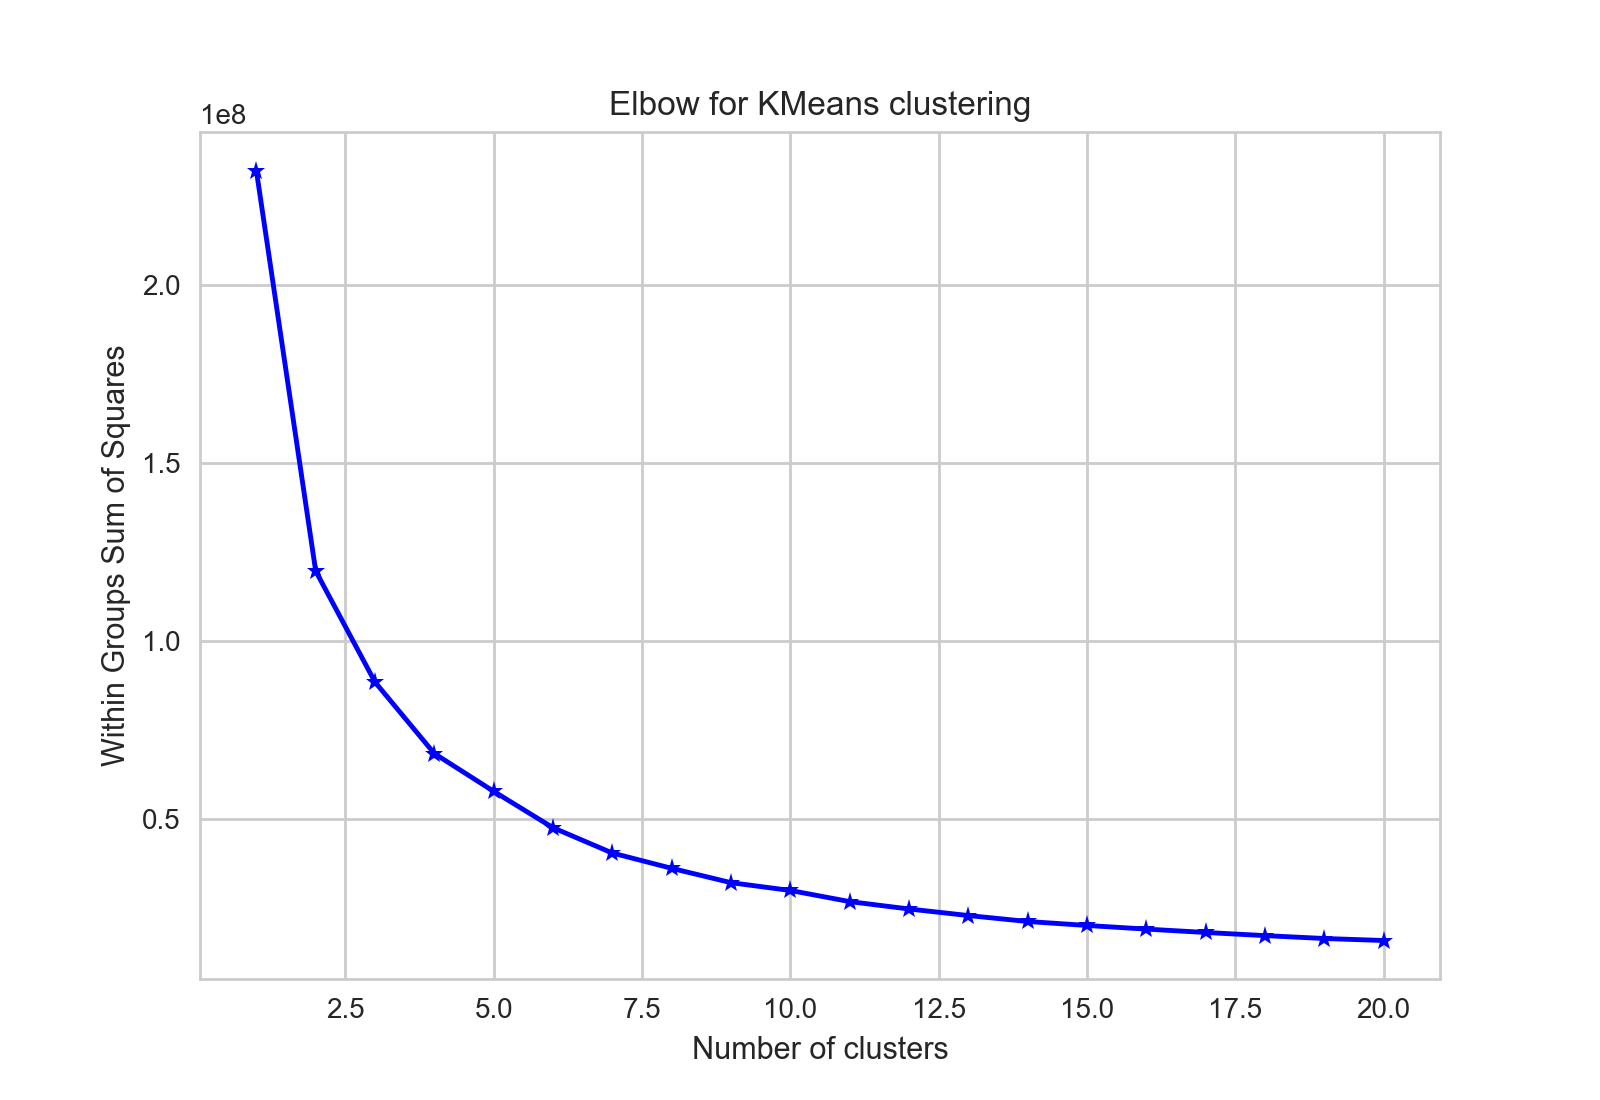
It would be useful to have a better group distribution but how do we select the optimal value for k for the clustering. Here we have plotted the variation between the number of clusters and the sum of the variance of all the points in the respective cluster. From the graph, we infer that k >= 6 will give a pretty good distribution.
Using patient data to analyse the doctor, i.e. the type of people who visit him/her, male-female ratio and helping the doctor to have an optimal appointment schedule.